Cosmograph

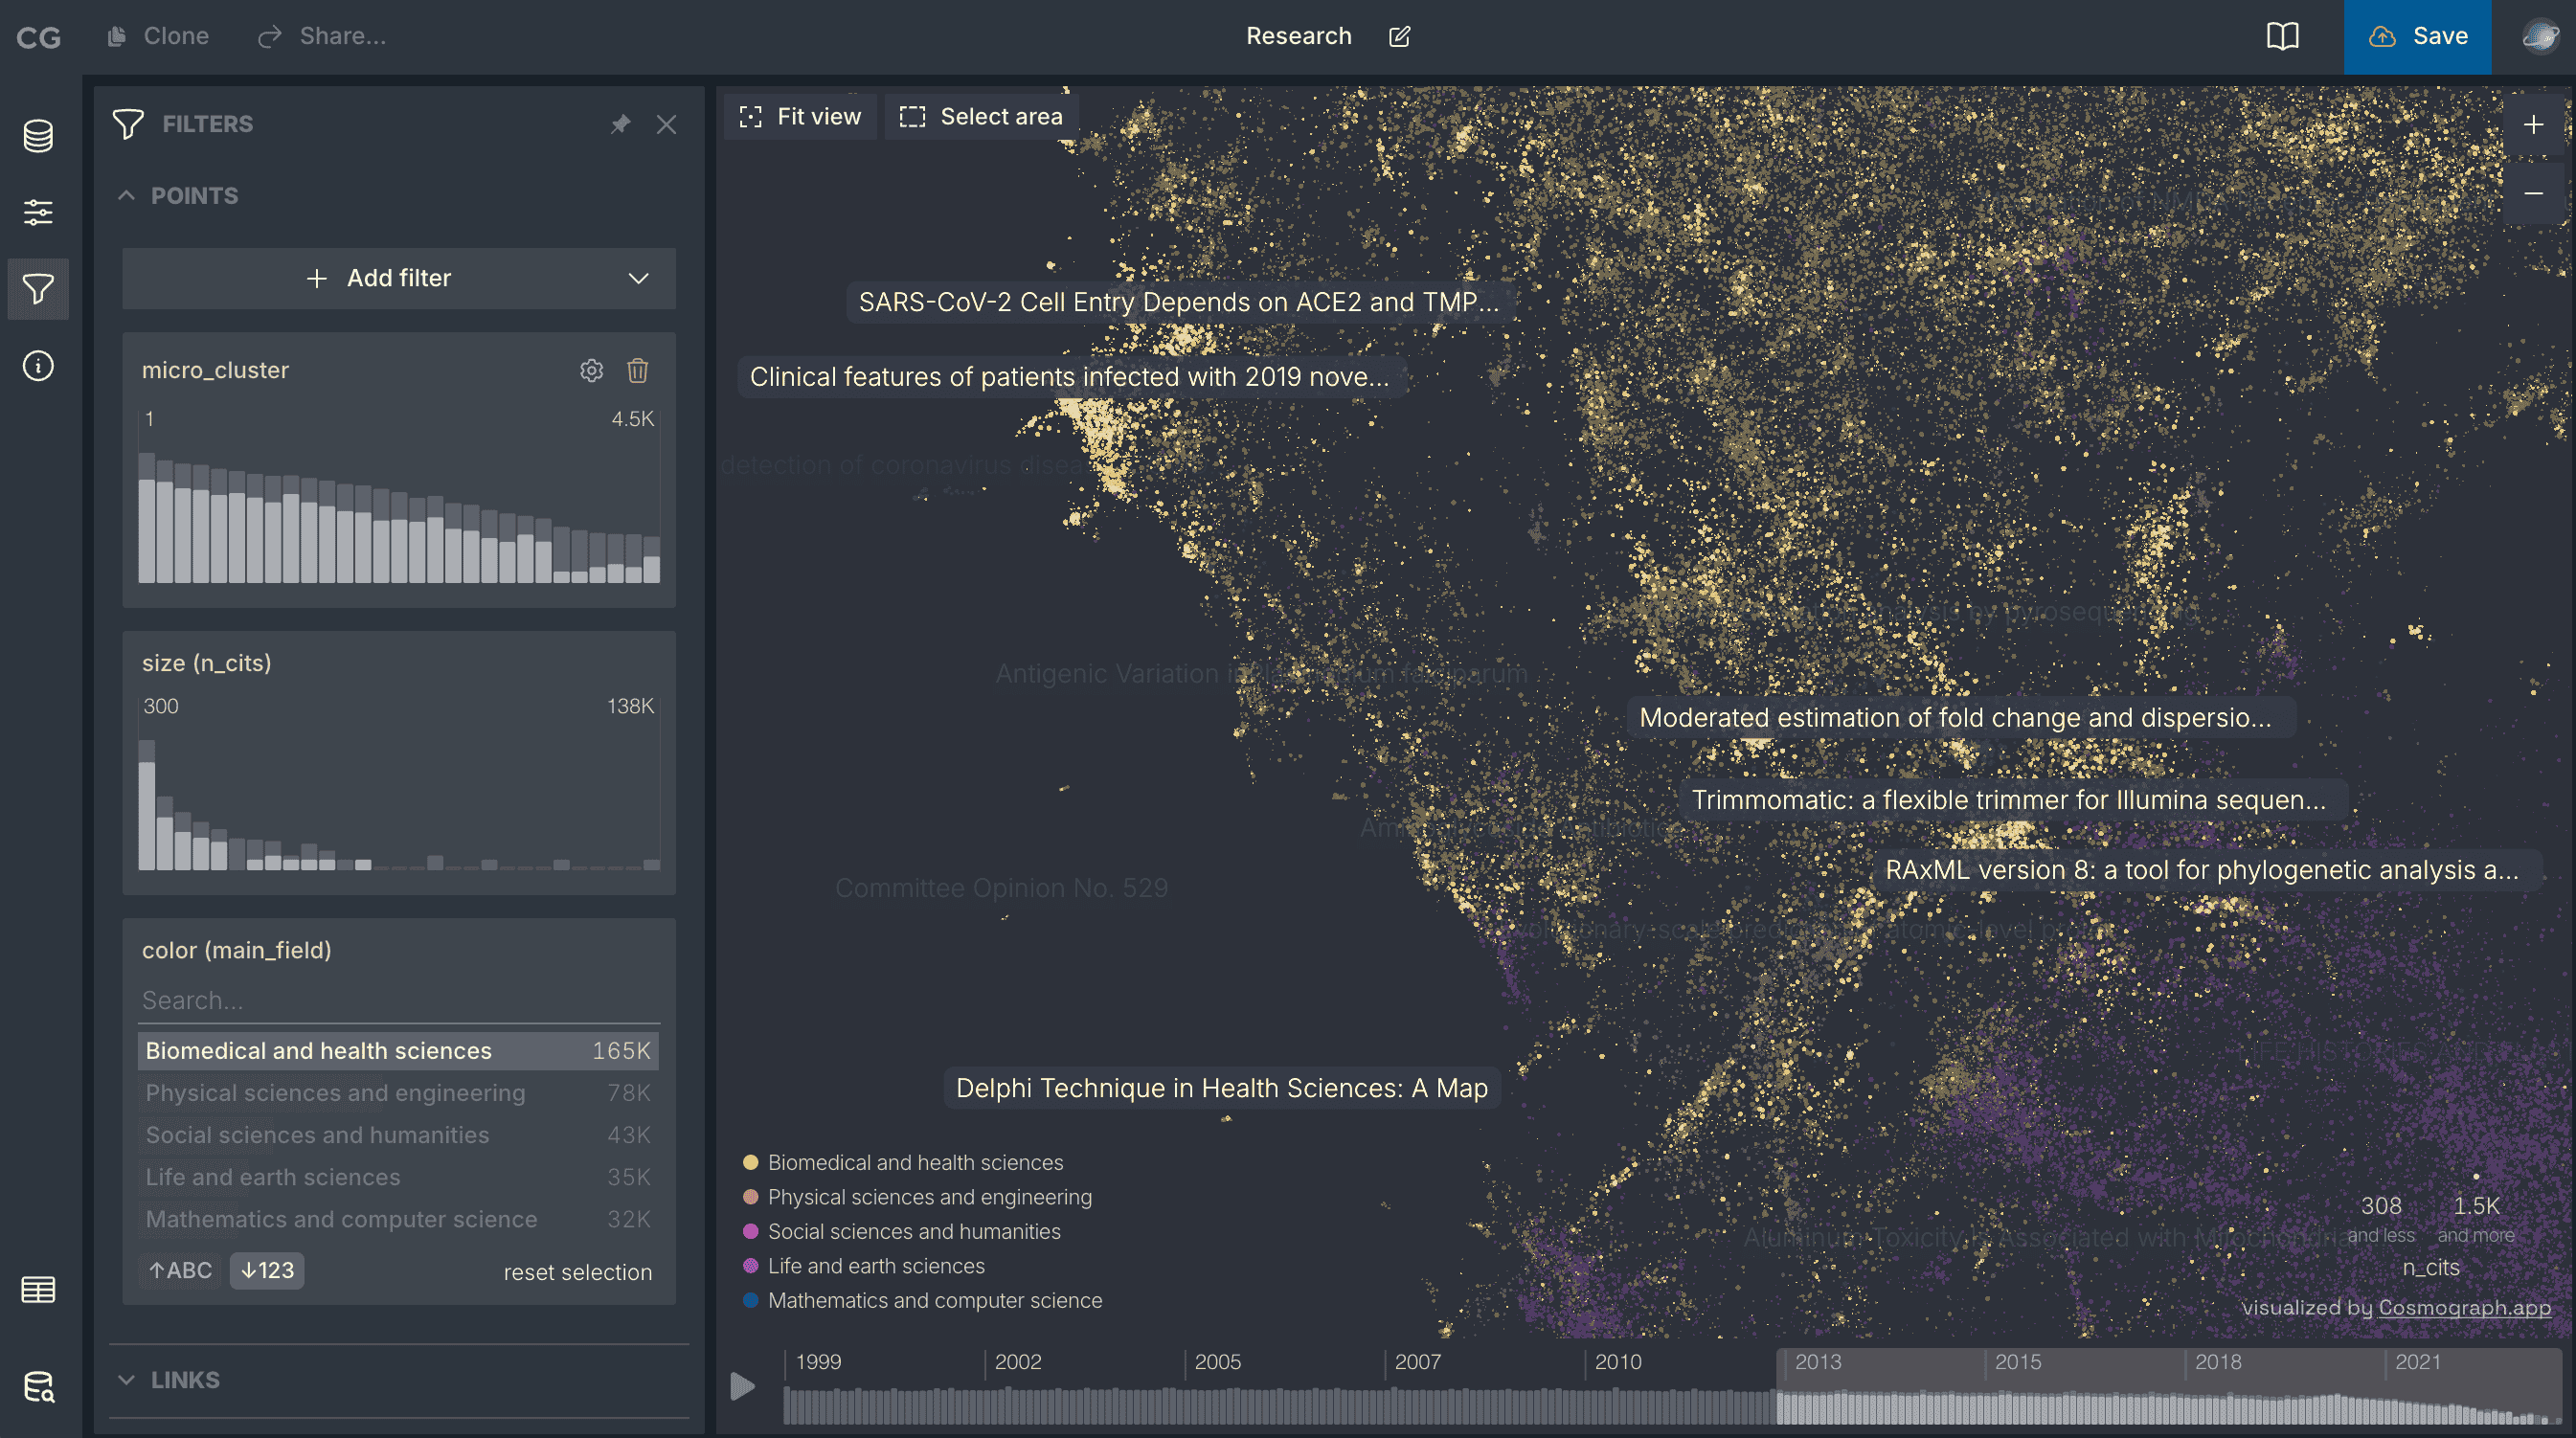
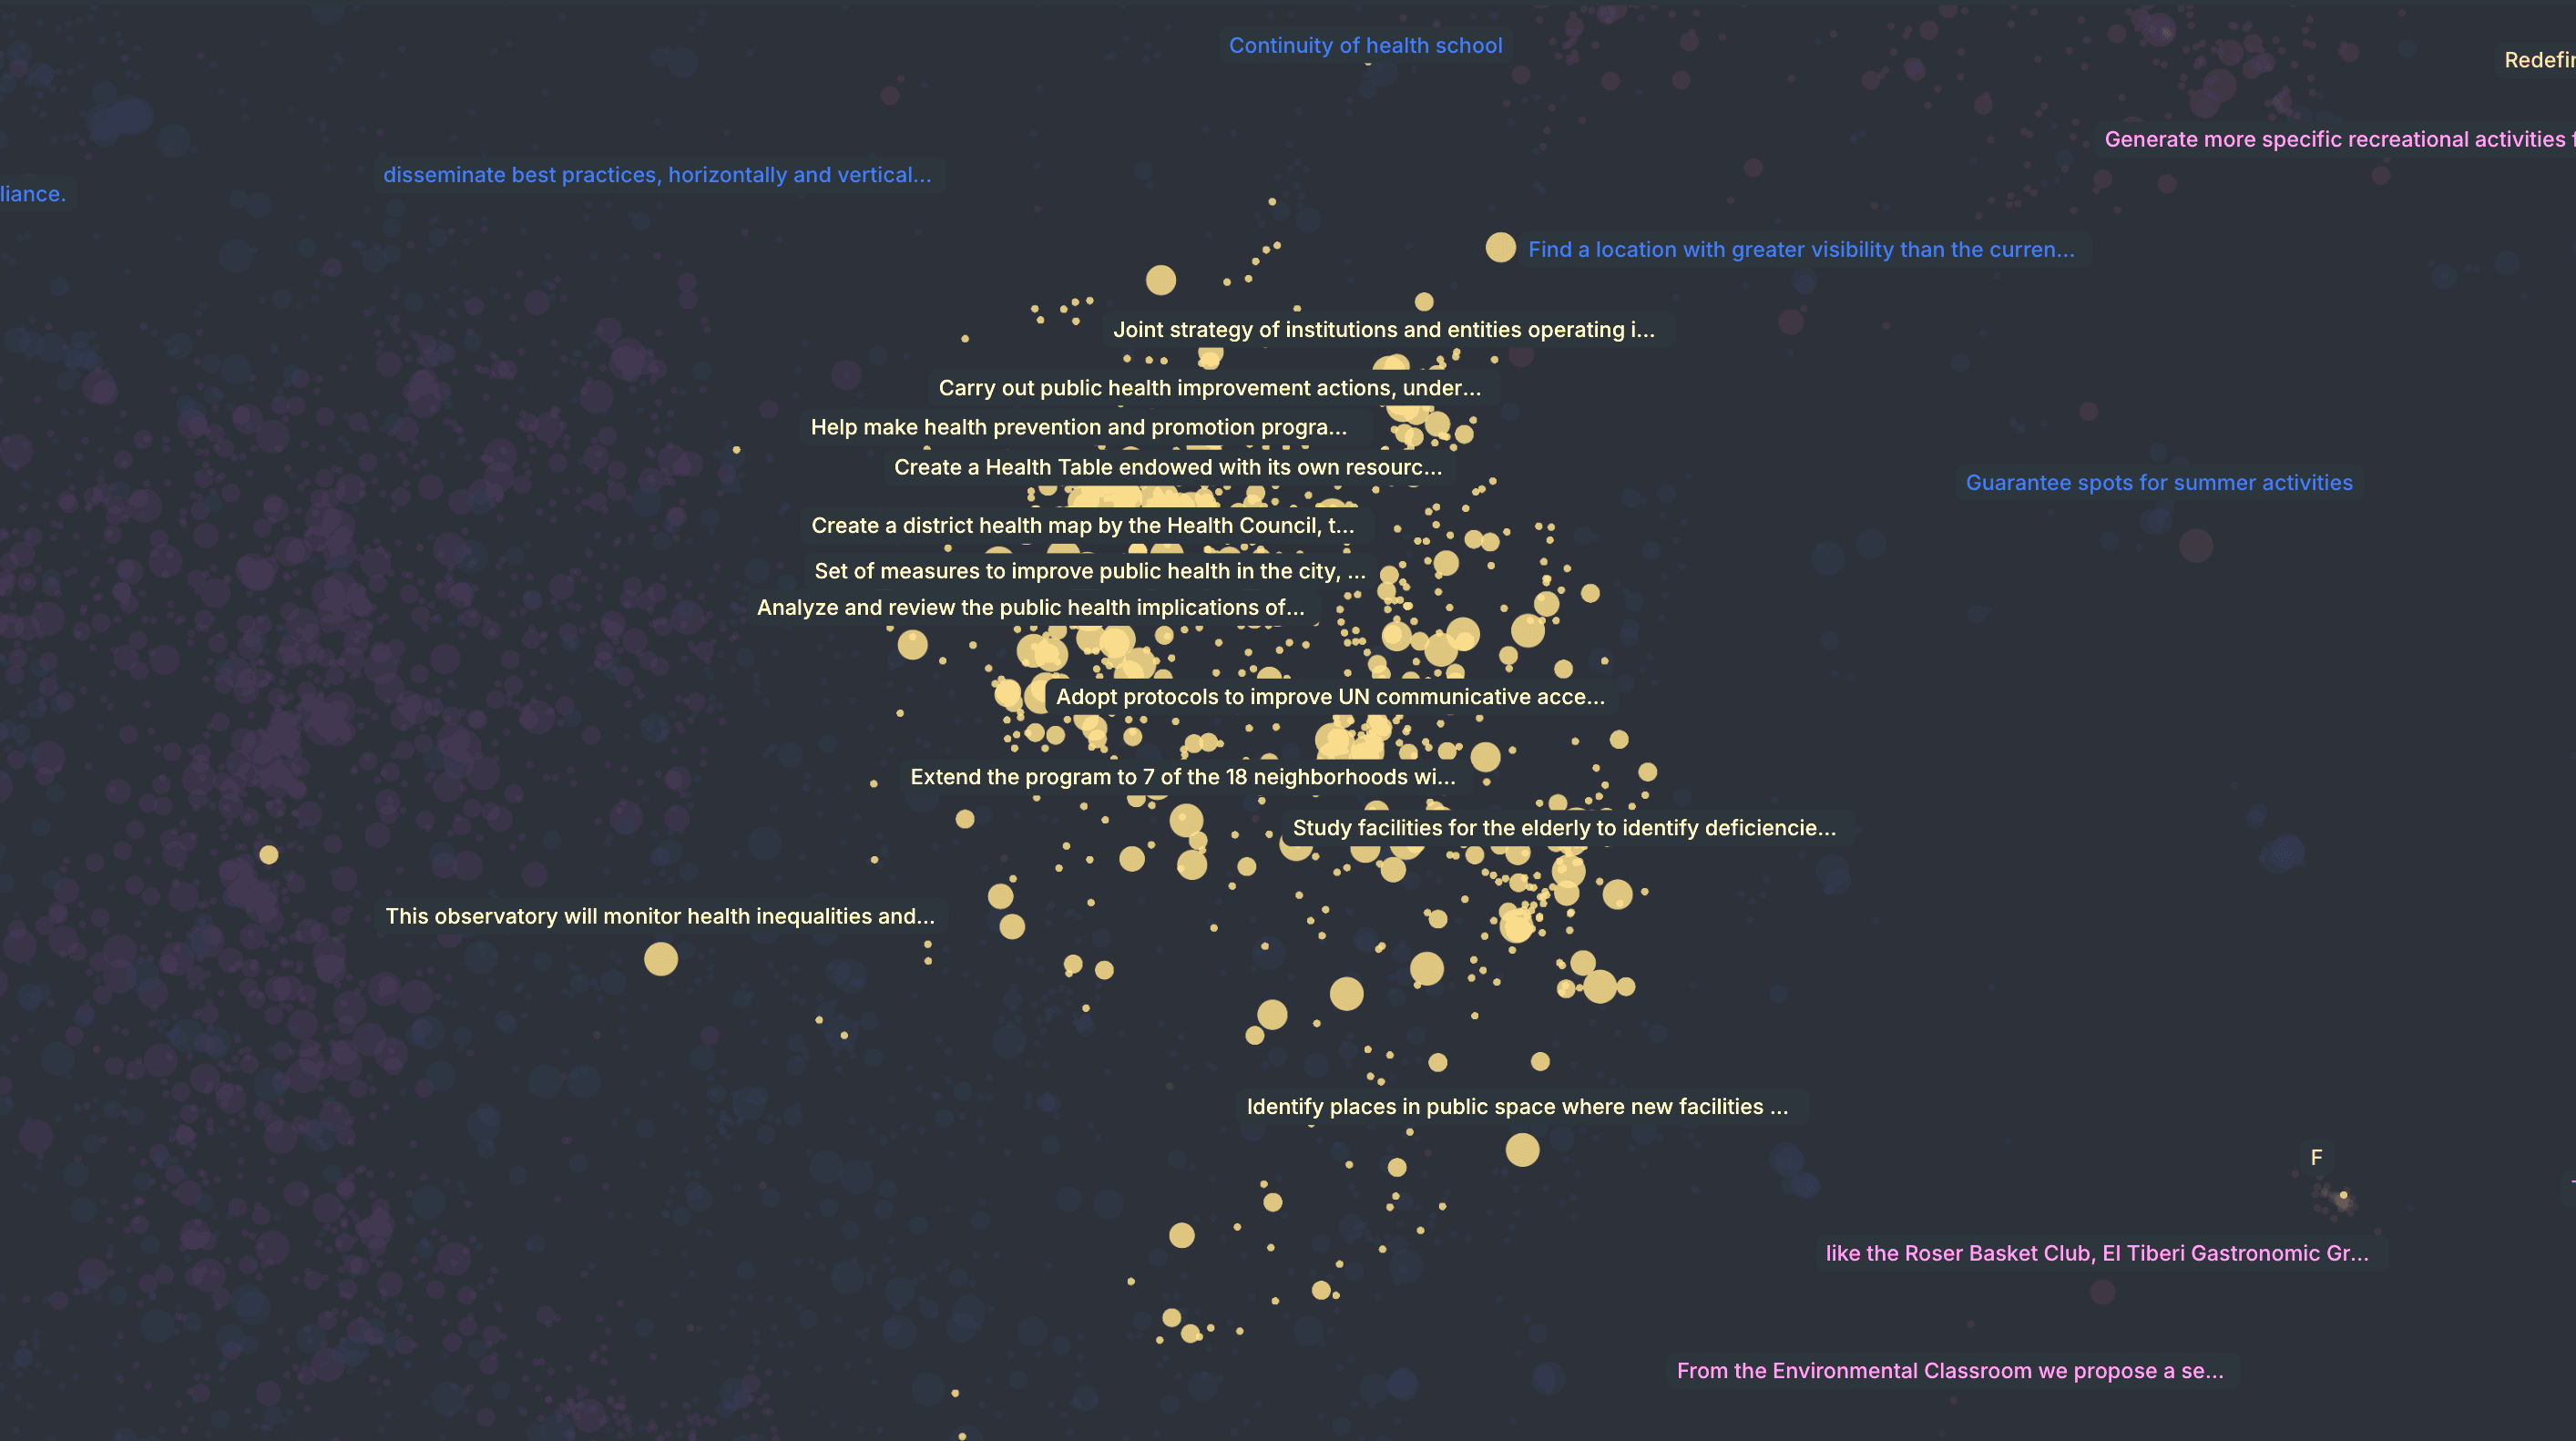
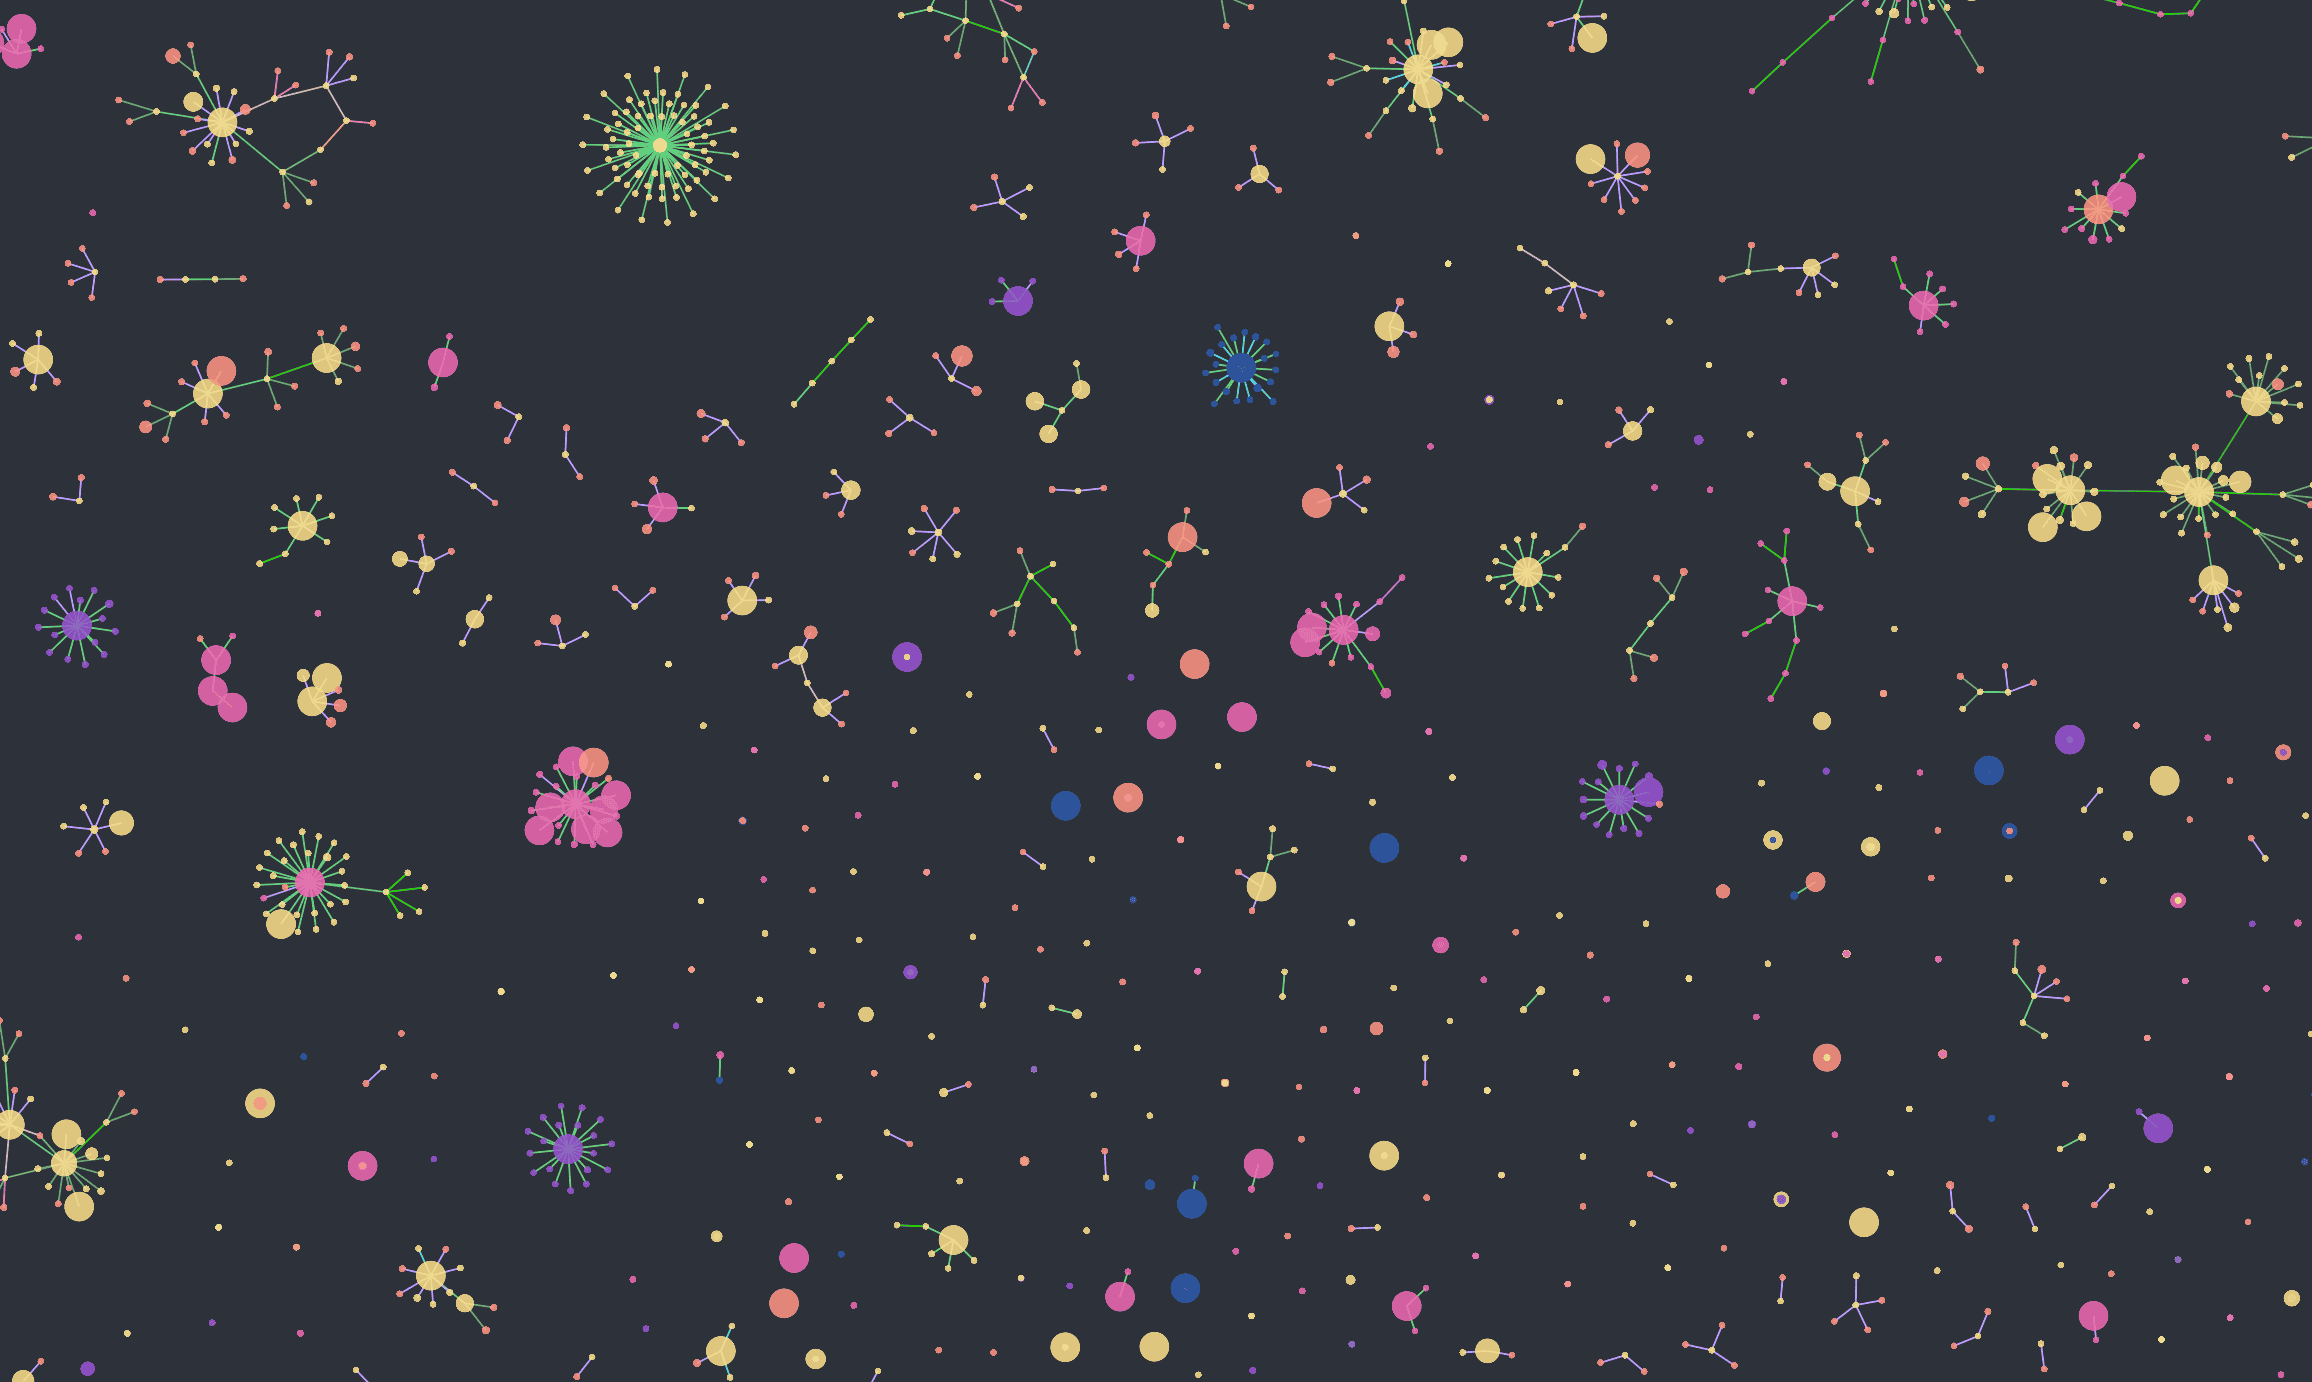
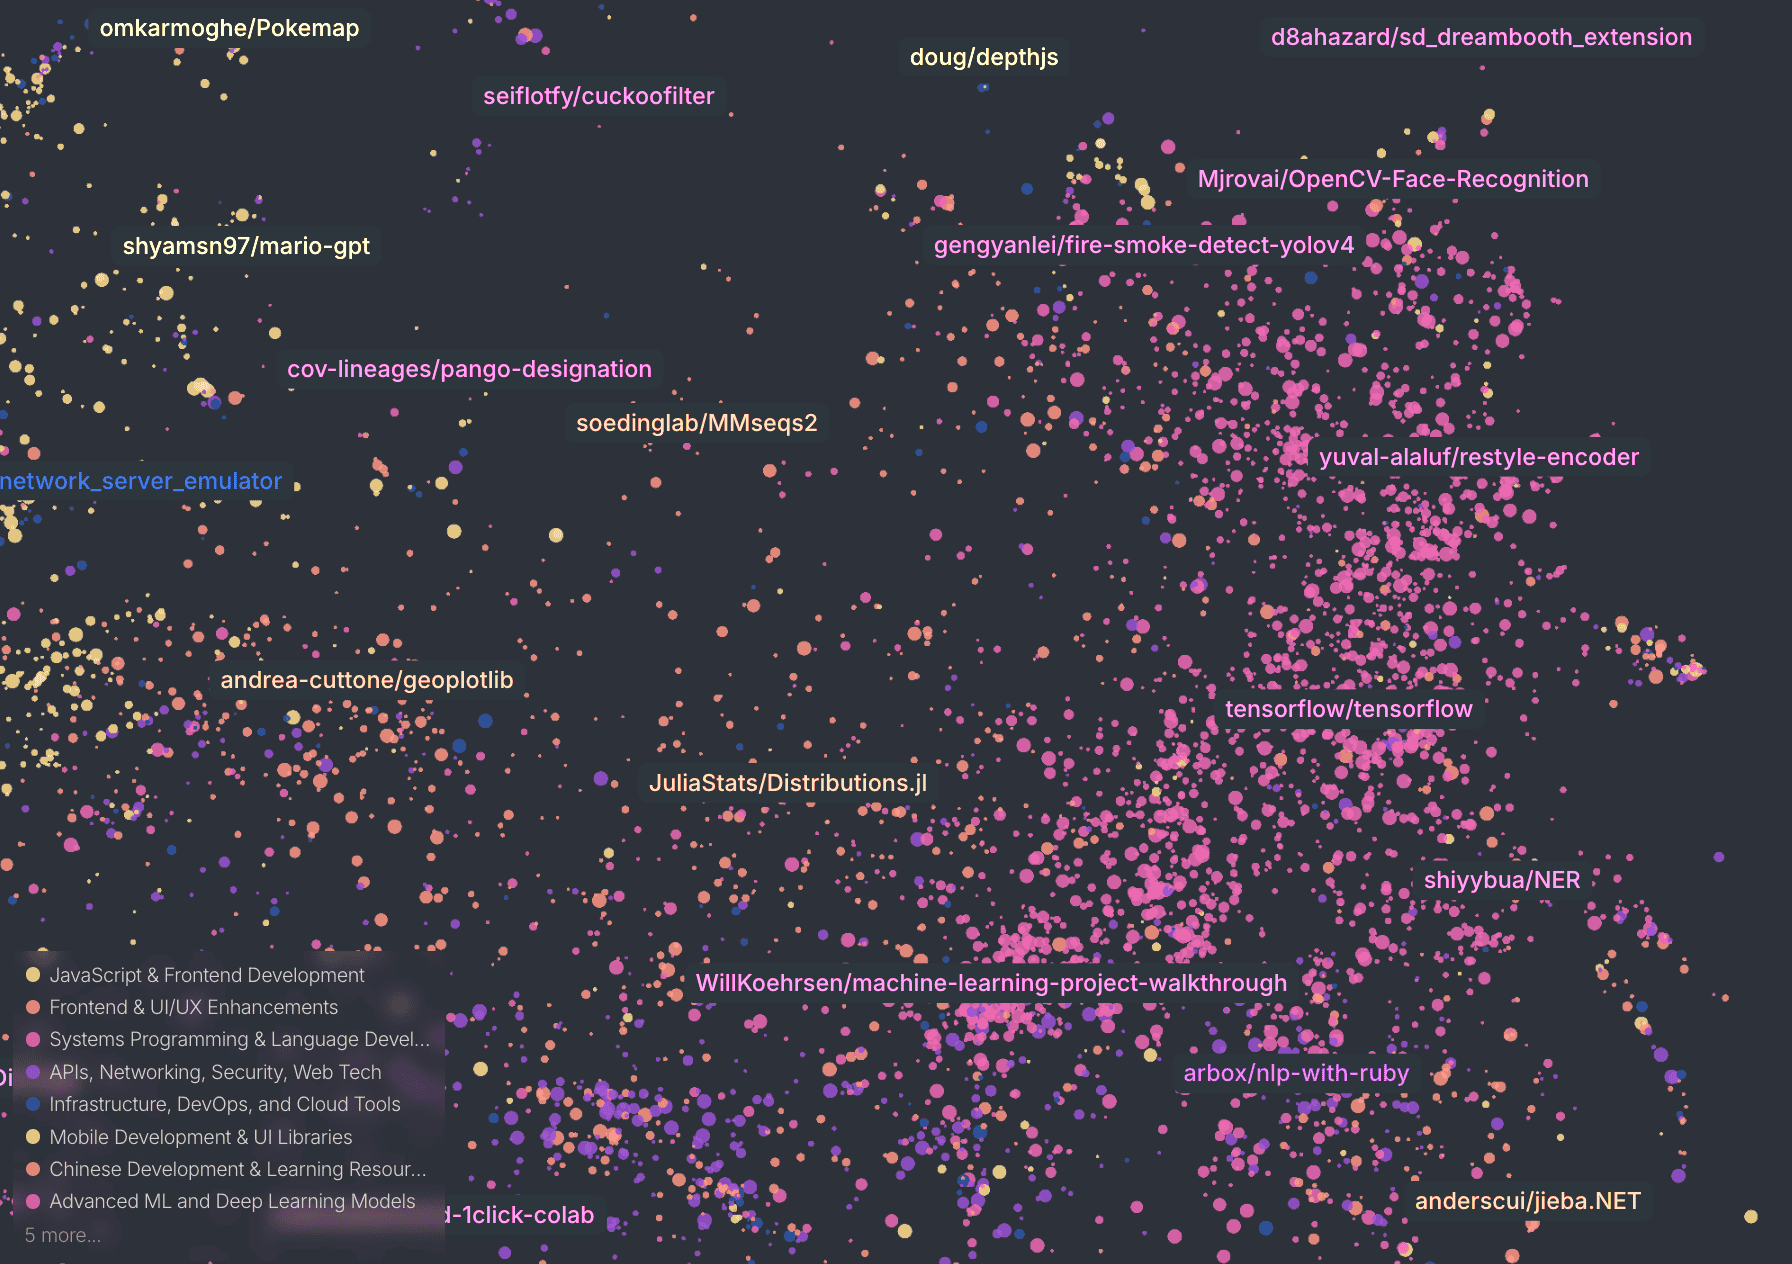
Cosmograph is a powerful and flexible visualization component built on top of the @cosmograph/cosmos GPU-accelerated force graph layout algorithm and rendering engine. With its extensive configuration options and seamless integration with other components, Cosmograph is an essential tool for building graph data-driven applications.

Creating a Cosmograph instance

import { Cosmograph, CosmographProvider } from '@cosmograph/react'

export const Component = ({ nodes, links}) => {
return (
<Cosmograph nodes={nodes} links={links} />
)
}

Passing the data and configuration

If you use React, the data and configuration can be passed as props to the Cosmograph component. React will take care of updating the graph when the data or configuration changes. If you use JavaScript, you can pass the data and configuration to the Cosmograph instance using the setData and setConfig methods.

<Cosmograph nodes={nodes} links={links} nodeColor={d => d.color} nodeSize={20} linkWidth={2} />
Loading embeddings

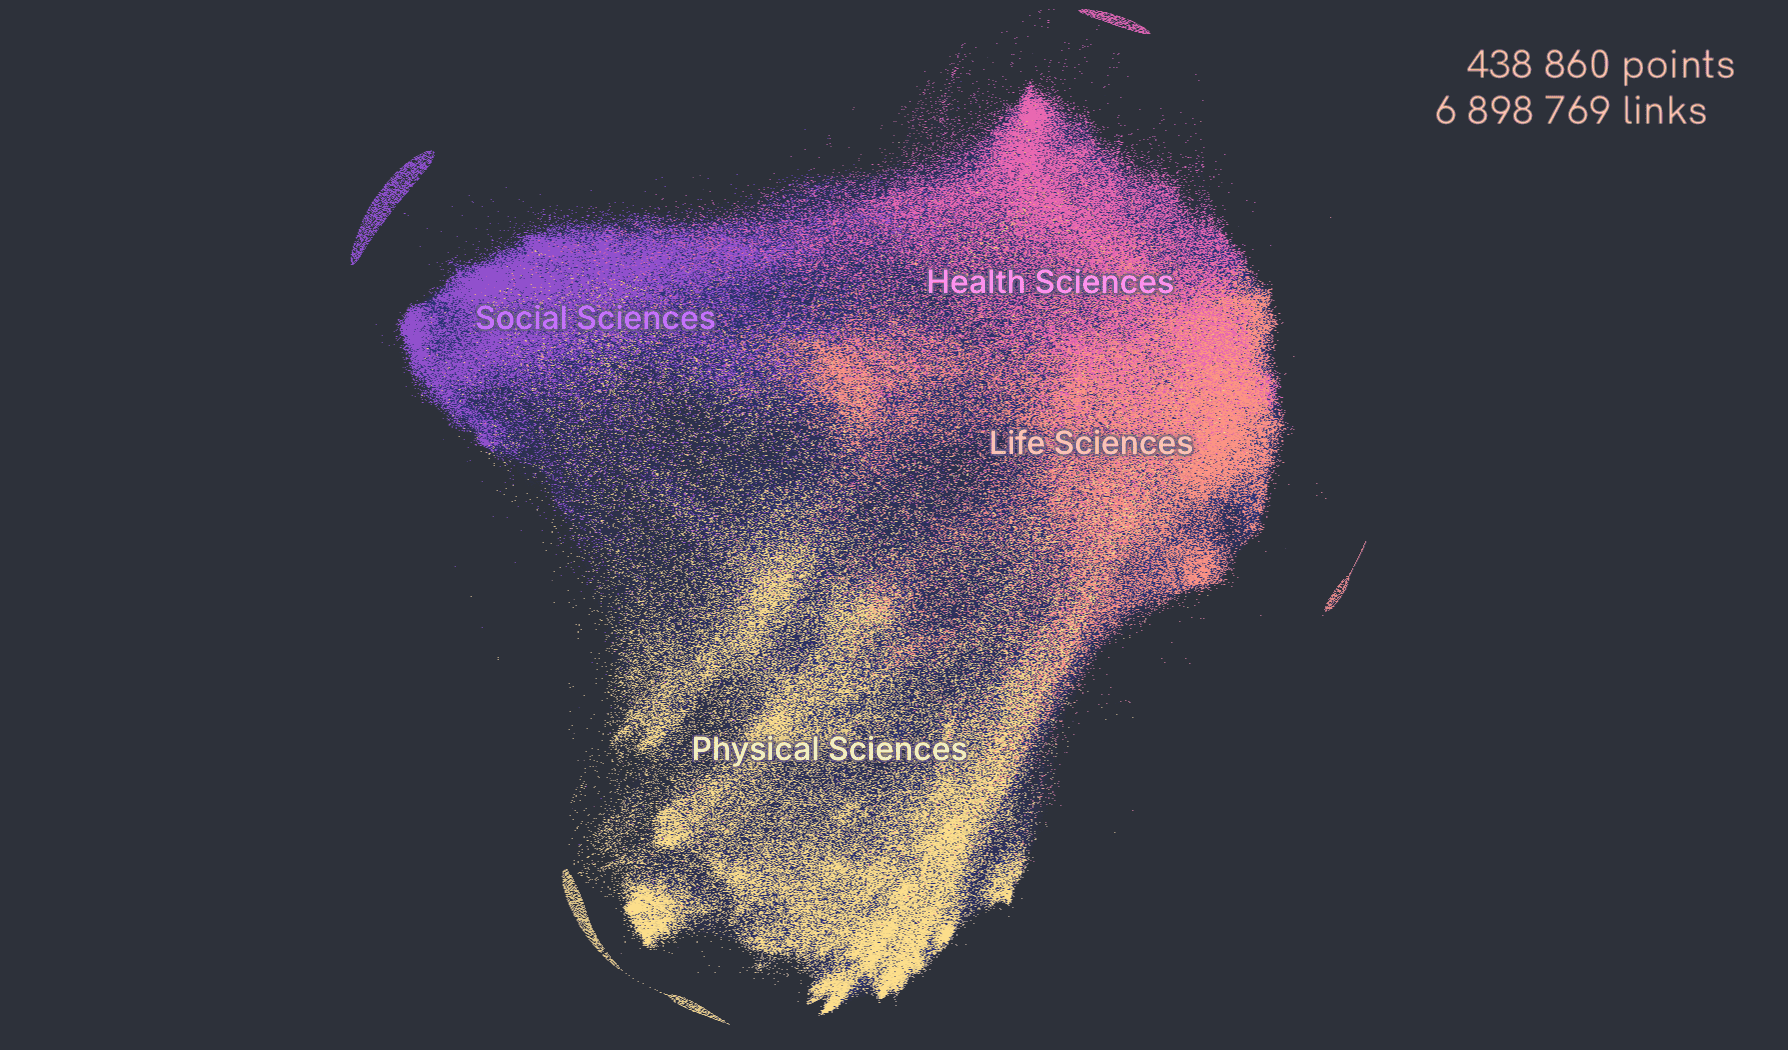
You can load only nodes without any links into Cosmograph. In this case, Cosmograph will automatically configure itself to render the nodes as embeddings, without running a simulation.

If you want to simulate a network with links between nodes, check the Simulation setttings section.

Rendering preferences

Node appearance

Loading...

The appearance of the nodes in the Cosmograph can be customized using various configuration properties. Here is a list of general properties that control the node appearance:

  • nodeColor allows you to define the color of the nodes. It can be either a function that determines the color dynamically based on the node properties, or just a color string that can be specified in any popular color format such as Hex or in RGBA format [number, number, number, number]. The default value is #b3b3b3.
  • nodeSize allows you to set the size of the nodes. Similar to nodeColor , it can be a function that determines the size dynamically based on the node properties, or a fixed value in pixels. The default value is 4.
  • nodeSizeScale is a scale factor that can be used to adjust the node size. It is useful when you want to implement a node scale slider. The default value is 1 .
  • scaleNodesOnZoom property is a boolean that determines whether the nodes should be scaled when zooming in or out. By default, it is set to true.

Node appearance configuration example

Here is a code example that demonstrates how to customize the size and color of the nodes:

<Cosmograph
...
nodeSize={(n, i) => n.size}
nodeColor={(n, i) => n.color}
/>

In this example, the nodeSize property is set to a function that accesses the size property for each node, and the nodeColor property is also set to a function that accesses the color property of the node.

Node states

Node can be selected, focused or hovered. Each state has its own set of properties.

Selected state is achieved when selectNode(), selectNodes(), or selectNodesInRange() is performed on a node. Multiple nodes can be in the selected state.

  • nodeGreyoutOpacity defines the opacity of the unselected nodes when a selection is active. It visually distinguishes the selected nodes from the rest. The default value is 0.1.

Focused state is set using focusNode(). When a node is focused, a focus ring is rendered around it. Only one node can be in the focused state at a time.

  • focusedNodeRingColor sets the color of the focus ring. The default color is white.

Hovered state occurs when the mouse hovers over a node. When a node is hovered, a hover ring is rendered around it. Only one node can be in the highlighted state.

  • renderHoveredNodeRing property is a boolean that enables or disables the node hovered state logic on hover. By default, it is set to true.
  • hoveredNodeRingColor sets the color of the hover ring. The default color is white.

Hovered node has an individual label and there is a special onNodeMouseOver callback for hovered node.

info

Hovered and focused are different states that render a relevant ring around node. Both hoveredNodeRingColor and focusedNodeRingColor can be specified in a Hex or common color name like red.

Example showing difference between hovered and focused nodes

Loading...
import React, { useRef, useEffect } from 'react'
import { Cosmograph } from '@cosmograph/react'

export function Example ({ nodes, links }) {
// Create a ref to hold the Cosmograph instance
const cosmographRef = useCallback((ref) => {
// Focus node after Cosmograph mount
ref?.focusNode({ id: 'node0' })
}, [])

return (<>
<Cosmograph
ref={cosmographRef}
hoveredNodeRingColor={'red'}
focusedNodeRingColor={'yellow'}
... />
</>)
}

Node labels

Node labels are used to display text for each node in a visualization. By default, the id property of a node is used as the label text. However, you can customize the label text for each node using the nodeLabelAccessor property.

  • nodeLabelAccessor takes a function that accepts a node object as input and returns a string. You can use this function to generate custom label text based on the properties or other data associated with each node. Default nodeLabelAccessor function n => n.id uses the id property of the node as the label text. However, you can provide your own function with string as result to generate the desired label text for each node.
Loading...

Label types and controlling them

There are few types of labels: dynamic, top, hovered and custom. They represent individual groups and does not intersect.

Dynamic labels appear for the currently visible nodes on the screen while zooming in and hide while zooming out. They help quickly identify nodes at different levels of zoom.

  • showDynamicLabels used to control whether or not dynamic labels are displayed. The default value is true.

Top labels are labels for the nodes with the highest number of connections by default. Alternatively, if showTopLabelsValueKey is specified, top labels will be shown for the nodes with the highest values of this key.

  • showTopLabelsValueKey represents a string key of a node property to calculate the top nodes by. The default value is undefined.
  • showTopLabelsLimit property sets the maximum number of top nodes to show labels for, with a default value of 100.
  • showTopLabels is a boolean that turns the top node labels on or off. The default value is false.

Hovered label is a single label that displays for the currently hovered node.

  • showHoveredNodeLabel property is a boolean that turns the label for the hovered node on or off. The default value is true.

Specific labels

You can display labels for specific nodes by providing an array of nodes to the showLabelsFor property. These labels will always be visible for the listed nodes. You can provide the entire nodes as well as objects with only their ids. By default, this array is empty, meaning no custom labels will be shown.

Here's an example of how to use the showLabelsFor property to show specific labels only by node ids:

<Cosmograph
...
showDynamicLabels={false}
showLabelsFor={[{ id: "node0" }, { id: "node3" }]}
/>
Loading...

tip

To turn off labels completely, you will need to set showDynamicLabels , showTopLabels , and showHoveredNodeLabel to false , and ensure that showLabelsFor is empty.

Labels style

To style node labels using CSS, you can use the following properties:

  • nodeLabelClassName specifies the CSS class to apply to the labels. It can be set to a string or a function that returns a string representing the CSS class to use for the labels. The default value is undefined.
  • hoveredNodeLabelClassName property specifies the CSS class to apply for the hovered node label same way as for nodeLabelClassName. The default value is undefined.
  • nodeLabelColor can be set to a string or a function that returns a string representing the color to use for the label in a CSS-acceptable color format. The default value is undefined.
  • hoveredNodeLabelColor property work in the same way, but apply to the label when the node is hovered over. The default value is undefined.

By utilizing these properties, you can style the labels of nodes in various ways, allowing you to differentiate them from other elements within the graph.

The look of links in the Cosmograph can be customized using the following properties:

  • renderLinks is a boolean that determines whether to render the links. The default value is true.
  • linkColor allows you to define the color of the links. It can be either a function that determines the color dynamically based on the link properties, or just a color string that can be specified in any popular color format such as Hex or in RGBA format [number, number, number, number]. The default value is #666666.
  • linkWidth is a function that returns a number or a single numerical value in pixels that determines the width of the links. The default value is 1.
  • linkWidthScale is a scale factor for the link width. The final link width calculated by multiplying the linkWidth value by the linkWidthScale. The default value is 1.
  • linkArrows property is a boolean that controls whether arrows are displayed at the ends of the links. By default, this property is set to true.
  • linkArrowsSizeScaleis a scale factor for the size of the link arrows. The default value is 1 .
  • linkGreyoutOpacity is responsible for opacity of the links when the selection is active. It can be specified from 0 to 1, with a default value of 0.1.
  • linkVisibilityDistance defines the minimum and maximum of link lengths in pixels. Links shorter than the minimum length will be fully opaque. Links longer than the maximum length will have a minimum transparency set by linkVisibilityMinTransparency. For links between those two length values, the transparency will be interpolated between fully opaque and the minimum transparency. So as you zoom in and out, links will become more or less transparent depending on their length. This helps focus on local connections over long range connections by making long links more transparent. The default range is [50, 150].
  • linkVisibilityMinTransparency is a transparency value that the link will have when its length reaches the maximum link distance value from linkVisibilityDistanceRange, The default is 0.25, meaning the longest links will have 25% transparency.
info

Curved links enhance graph aesthetic appeal but can potentially impact performance due to the additional computational complexity involved in rendering them.

  • curvedLinks is a boolean that determines whether to render curved links. The default value is false.
  • curvedLinkSegments is a number of segments in a curved line. More segments can result in slower rendering performance. Default is 19.
  • curvedLinkWeight affects the shape of the curve. Higher values will create more curved links, while lower values will be more straight. Default is 0.8. curvedLinkControlPointDistance defines the position of the control point of the curve on the normal from the center of the line. If set to 1, the control point is at a distance equal to the length of the line. Default is 0.5.
const colors = ['#88C6FF', '#FF99D2', '#2748A4'];

<Cosmograph
linkWidth={() => 1 + 2 * Math.random()}
linkColor={() => colors[Math.floor(Math.random() * colors.length)]}
...
/>
Loading...

Tweaking zoom

  • initialZoomLevel sets the custom number for initial zoom level. This property can be helpful if the graph appears too small and needs to be scaled up for better visibility. Default: 1.
  • disableZoom boolean disables zoom and drag events, preventing users from zooming in or out and dragging the graph canvas. This can be useful in scenarios where zooming and dragging functionality is not desired. Default: false.

Fitting view

info

These properties have effect only during initialization. You can check methods to fit viewport after initialization here.

  • fitViewOnInit determines whether to center and zoom the view to fit all nodes in the scene on initialization. The default value is true.
  • fitViewDelay specifies a delay in milliseconds before fitting the view. It is useful if you want the layout to stabilize a bit before fitting the view. The default value is 250.
  • fitViewByNodesInRect is used when fitViewOnInit is set to true. It defines the corner coordinates [[left, bottom], [right, top]] of the rectangle that encloses the nodes in the scene. The default value is undefined.

Miscellaneous

  • backgroundColor sets the canvas background color. The default value is #222222.
  • showFPSMonitor shows or hides the WebGL performance monitor. The default value is false.
  • pixelRatio property sets the canvas pixel ratio. A higher value for pixelRatio results in sharper graph elements. However, setting a value higher than the target device's pixel ratio may not have any effect. It's important to note that setting a higher pixelRatio can impact performance on certain machines. The default value for pixelRatio is 2.
  • nodeSamplingDistance specifies the minimum distance in pixels between sampled nodes when calling the getSampledNodePositionsMap() method. It controls the density of the node sampling - larger values will result in fewer nodes being included in the sample. The default value is 150 pixels.

Simulation settings

Cosmograph detects if a graph only contains nodes without links. In this case, it will automatically disable the simulation, since running a force simulation would have no effect without links between nodes. However, if links are present in the graph data, Cosmograph will enable the simulation by default to position the nodes based on the links and forces.

This automatic behavior of enabling or disabling the simulation can be overridden through configuration if desired.

Disabling simulaiton

warning

The disableSimulation property can be tweaked during initial configuration. This means any changes will take effect until data is set.

The disableSimulation property controls whether Cosmograph runs a force layout simulation or acts as just a renderer for pre-computed embeddings.

disableSimulation can be set to true, false, or null. When disableSimulation is true, the simulation is disabled and Cosmograph just renders the graph. Node positions are determined by the x and y values in the data. If x and y are not specified, random positions are assigned.

If set to null, Cosmograph will check for links when data is first loaded. If links exist, it sets disableSimulation to false to enable simulation. If no links exist, it sets disableSimulation to true to disable simulation.

Default value for disableSimulation is null.

Initialization parameters

info

This properties is applied only during the initialization of the Cosmograph.

  • spaceSize defines the size of the simulation space. The maximum value is 8192, limited by the end user's GPU specifications. Increasing the space size allows nodes more room to move around. The default value is 4096 .
  • randomSeed controls the randomness of the layout across different simulation runs. It can be number or string. Default: undefined.

Forces

Tweaking simulation forces allow to customize and fine-tune the behavior of the forces within the system, enabling them to create dynamic and interactive simulations of nodes interaction.

NameDescriptionRecommended rangeDefault
simulationRepulsionControls the repulsion force coefficient, determining the strength of node repulsion. Increase for stronger repulsion, decrease for weaker repulsion.0.0-2.0 0.1
simulationRepulsionThetaControls the level of detail in Many-Body force calculations. When useQuadtree is enabled, it corresponds to the Barnes-Hut approximation criterion. Higher values provide more accurate calculations, while lower values give faster but less precise results.0.3-2.01.7
simulationLinkSpringAdjusts the link spring force coefficient, determining the strength of attraction between connected nodes. Increase for stronger attraction, decrease for weaker attraction.0.0-2.01.0
simulationLinkDistanceDefines the minimum distance between linked nodes, affecting their positioning. Increase for more spacing, decrease for closer proximity.1-202
simulationGravityAdjusts the gravity force coefficient, determining how much nodes are attracted towards the center of the graph. Increase for stronger gravitational pull towards the center, decrease for weaker attraction.0.0-1.00.0
simulationCenterChanges the centering force coefficient, pulling nodes towards the center of the graph. Increase for more centered nodes, decrease for less centralization.0.0-1.00.0
simulationFrictionControls the friction coefficient, affecting how much nodes slow down over time. Higher values result in slower movement and longer simulation time, lower values allow faster movement and quicker convergence.0.8-1.00.85
simulationDecayControls the force simulation decay coefficient. Higher values make the simulation "cool down" slower. Increase for a longer-lasting simulation, decrease for a faster decay.100-100001000
simulationRepulsionFromMouseSets the repulsion force coefficient from the mouse cursor. Activates the repulsion force when the right mouse button is pressed. Increase for stronger repulsion from the cursor click, decrease for weaker repulsion.0.0-5.02.0
<Cosmograph 
...
simulationFriction={0.1}
simulationLinkSpring={0.5}
simulationLinkDistance={2.0}
/>
Loading...

Quadtree algorithm

The experimental quadtree settings in the Cosmograph library enable the use of the classic quadtree algorithm for the Many-Body force. This algorithm helps optimize the calculations involved in the force simulation.

  • useQuadtree: When set to true, this property activates the quadtree algorithm for the Many-Body force. It is applied during the initialization of the Cosmograph component. The default value is false.

  • repulsionQuadtreeLevels: This property defines the depth of the Barnes-Hut approximation used by the quadtree algorithm. It can only be used when useQuadtree is set to true. Adjusting this value allows you to balance between accuracy and performance in the force simulation. Higher values provide more accurate results at the cost of longer computation time, while lower values offer faster but less precise simulations. The recommended range for this property is between 5 to 12, with a default value of 12.

useQuadtree limitations

useQuadtree might not work on certain GPUs (e.g., Nvidia) and on Windows, unless ANGLE is disabled in the browser settings.

Events configuration

Cosmograph supports several event handlers allowing you to react to user interactions with the graph. Try clicking on a node in the example below:

Loading...

Mouse and zoom events

onClick(clickedNode?: N, index?: number, nodePosition?: [number, number], event: MouseEvent)

Triggered on every canvas click. If clicked on a node, its data will be passed as the first argument, index as the second argument, position as the third argument and the corresponding mouse event as the forth argument.

onLabelClick(node: N, event: MouseEvent)

Called when clicked on a label. The node data for this label will be passed as the first argument, and the corresponding mouse event as the second argument.

onMouseMove(hoveredNode?: N, index?: number, nodePosition?: [number, number], event: MouseEvent) => void

Called when mouse movement occurs. If the mouse hovers over a node, it receives the hovered node's data, index, position, and the corresponding mouse event as arguments.

onNodeMouseOver(hoveredNode: N, index: number, nodePosition: [number, number], event?: MouseEvent | D3ZoomEvent<HTMLCanvasElement, undefined>

Invoked when a node becomes highlighted, i.e. appears under the mouse as a result of a mouse event, zooming and panning, or movement of nodes. It receives the node's data, index, position, and the corresponding mouse event or D3 zoom event as arguments.

onNodeMouseOut(event?: MouseEvent | D3ZoomEvent<HTMLCanvasElement, undefined>)

Called when node is no longer underneath the mouse pointer because of a mouse event, zoom/pan event, or movement of nodes. The corresponding mouse event or D3 zoom event event will be passed as the first argument.

onZoomStart(event: D3ZoomEvent<HTMLCanvasElement, undefined>, userDriven: boolean)

Triggered when zooming or panning starts. It receives a D3 zoom event as the first argument and a boolean indicating whether the event was initiated by a user interaction.

onZoom(event: D3ZoomEvent<HTMLCanvasElement, undefined>, userDriven: boolean)

This callback function is continuously called during zooming or panning. It receives a D3 zoom event as the first argument and a boolean indicating whether the event was initiated by a user interaction.

onZoomEnd(event: D3ZoomEvent<HTMLCanvasElement, undefined>, userDriven: boolean)

Called when zooming or panning ends. It receives a D3 zoom event as the first argument and a boolean indicating whether the event was initiated by a user interaction.

Simulation callbacks

Cosmograph also supports several callbacks that allow you to react to simulation events:

onSimulationStart()

This callback function is triggered when the simulation starts

onSimulationTick(alpha: number, hoveredNode?: N, index?: number, nodePosition?: [number, number])

Callback function that will be called on every simulation tick. The value of the argument alpha will decrease over time as the simulation "cools down". If there's a node under the mouse pointer, its datum will be passed as the second argument, index as the third argument and position as the forth argument.

onSimulationEnd()

Triggered when the simulation stops.

onSimulationPause()

Triggered when the simulation pauses.

onSimulationRestart()

Callback function that will be called when the simulation is restarted.

This callback function executes when the data of the simulation is updated. It receives two parameters: an array of nodes and an array of links. Utilize this callback to respond to changes in the data and update the visualization accordingly.

Crossfilter callbacks

Cosomgraph has a built-in crossfilters that filters nodes and links arrays based on various selections such as Histogram, Timeline, Search or manual nodes or links selection through clicking or using the API like selectNodes. Cosmograph supports two callbacks that enable you to monitor changes in crossfilters:

onNodesFiltered(filteredNodes?: N[])

Triggered whenever the nodes array is filtered using node-based crossfilter.

Triggered whenever the links array is filtered using link-based crossfilter.

Controlling the graph

Cosmograph provides methods to control your graph. In JavaScript or TypeScript, you can call these methods directly on the Cosmograph instance. In React, you can access the Cosmograph instance using the useCallback or useRef hook. Here's an example of methods usage:

import React, { useRef, useEffect } from 'react'
import { Cosmograph } from '@cosmograph/react'

export function GraphVisualization ({ nodes, links }) {
// Create a ref to hold the Cosmograph instance
const cosmographRef = useRef(null)

const zoomToNode = () => cosmographRef.current?.zoomToNode({{ id: 'node0' }})

return (<>
<button onClick={zoomToNode}>Zoom to "node0"</button>
<Cosmograph ref={cosmographRef} nodes={nodes} links={links} ... />
</>)
}

Node methods

selectNode(node: N, selectAdjacentNodes: boolean)

Selects a specific node. An optional boolean flag selectAdjacentNodes that is false by default can be provided to select the adjacent nodes as well.

selectNodes(nodes: N[])

Selects a set of nodes by passing an array of nodes as an argument.

selectNodesInRange(selection: [[number, number], [number, number]] | null)

Selects the nodes within a specific range. The range can be specified as a two-dimensional array of boundaries or as null to unselect all nodes.

getSelectedNodes()

Returns an array of nodes that are currently selected.

unselectNodes()

Clears the selection and unselects all nodes.

focusNode(node?: N)

Sets focus to a specific node by drawing a circle around it. If no node is provided, the focus is reset.

getAdjacentNodes(id: string)

Returns an array of adjacent nodes to a specific node by its id, or undefined.

getNodePositions()

Get current X and Y coordinates of all nodes. Returns an object where keys are the ids of the nodes and values are corresponding { x: number; y: number } objects.

getNodePositionsMap()

Get current X and Y coordinates of all nodes. Returns a Map object where keys are the ids of the nodes and values are their corresponding X and Y coordinates in the [number, number] format.

getNodePositionsArray()

Get current X and Y coordinates of all nodes. Returns an array of [x: number, y: number] arrays.

getSampledNodePositionsMap()

Gets a Map of sampled node ids to their X and Y positions for nodes currently visible on screen. The number of nodes returned depends on nodeSamplingDistance configuration property, and nodes are evenly distributed.

getNodeDegrees()

Returns an array of node degree values (number of connections) in the order they were sent to Cosmograph.

getNodeRadiusByIndex(index: number)

Get node radius by its index.

getNodeRadiusById(id: string)

Get node radius by its id.

maxPointSize

Getter. Returns a numeric value that represents the maximum point size. This value is the maximum size of the gl.POINTS primitive that WebGL can render on the user's hardware.

Zooming

fitView(duration = 250)

The fitView method centers and zooms in or out the view to fit all nodes in the scene. durarion of animation for fitView() is passed in milliseconds and defaults to 250.

fitViewByNodeIds(ids: string[], duration = 250)

The fitViewByNodeIds method centers and zooms in or out the view to fit nodes by the list of passed ids. durarion of animation for fitView() is passed in milliseconds and defaults to 250.

zoomToNode(node: N)

Zooms the view to a specific node.

setZoomLevel(value: number, duration = 0)

Zooms the view in or out to the specified zoom level passed in value. The duration parameter specifies the duration of the zoom in/out transition and equals 0 by default.

getZoomLevel

Getter. Returns a numeric value that represents zoom level value of the view.

Simulation methods

start(alpha?: number)

Starts the simulation. Has an optional alpha argument that is responsible for simulation impulse. The higher the alpha, the more initial energy the simulation will get. The default is 1 with a valid range between 0 and 1.

pause()

Pauses the simulation.

step()

Render only one frame of the simulation. Stops the simulation if it was running.

restart()

Unpauses the simulation. Unlike the start() method, restart continues the simulation from its current state without giving a start impulse.

progress

Getter. Returns a simulation progress value that indicates how far the simulation has progressed from the start to the end. It is a number between 0 and 1, where 0 represents the start of the simulation and 1 represents the end.

isSimulationRunning

Getter. Returns a boolean that indicates simulation state.

Miscellaneous

remove()

Destroys the graph instance and cleans up the context.

create()

Create new graph instance.

spaceToScreenPosition(spacePosition: [number, number])

Converts the X and Y node coordinates from the space coordinate system to the screen coordinate system.

spaceToScreenRadius(spaceRadius: number)

Converts the node radius value from the space coordinate system to the screen coordinate system.

Questions? Contact us at
[email protected]